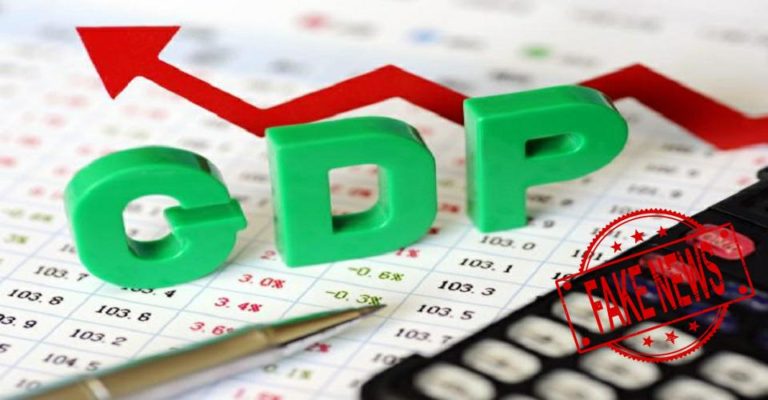
Contrary to the prevailing narrative on certain social media platforms claiming that the NDA’s average GDP growth surpasses that of the UPA, a closer examination of the actual data suggests a more nuanced picture. Let’s delve into the numbers to discern the facts from the fiction.
India’s socio-economic dynamics over the past few decades reflect a complex interplay of policy decisions, global events, and leadership directions. Dr. Manmohan Singh and Mr. Narendra Modi, both as prime ministers, steered India during contrasting epochs. By examining the GDP growth rates during their respective tenures, one can discern the impacts of their economic stewardship.
1. Manmohan Singh Era (2005-2014):
Background:
An acclaimed economist and the driving force behind India’s 1991 economic liberalization, Dr. Manmohan Singh’s prime ministership is often remembered for navigating India through turbulent global economic waters.
Economic Performance:
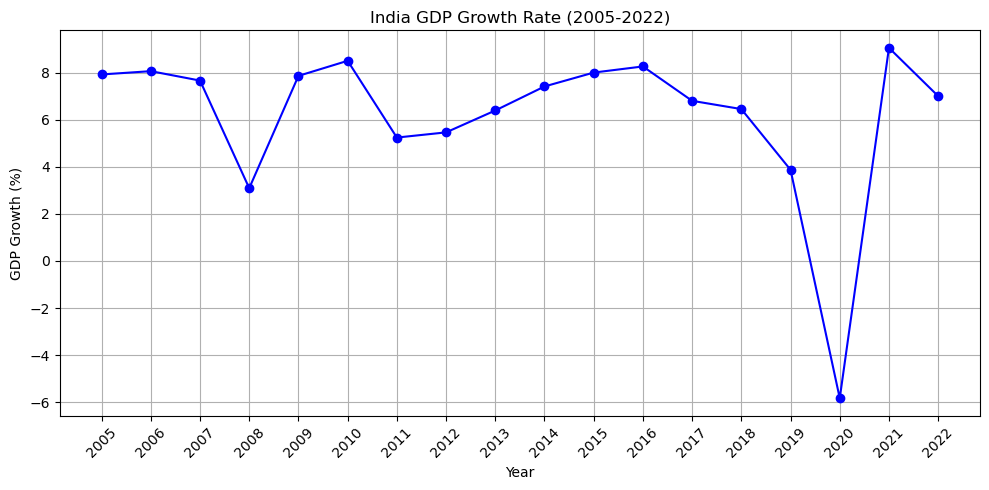
- Golden Era of Growth (2005-2008): Under Dr. Singh’s leadership, India experienced one of its highest GDP growth phases, averaging over 9% annually. These remarkable figures were not just numerical achievements but evidence of robust economic strategies and policy clarity.
- Resilience Amidst Global Financial Crisis (2008-2011): While the 2008 global crisis dented economies worldwide, Dr. Singh’s prudent economic policies cushioned India, enabling a swift recovery to 8.5% by 2010-11.
- Challenges Towards the End (2012-2014): Despite facing global headwinds and domestic pressures, Singh’s regime managed to keep growth figures respectable, reflecting his sagacious economic foresight.
Key Policies:
The era witnessed seminal policy frameworks like the introduction of the GST proposal and the Direct Benefits Transfer scheme. The Mahatma Gandhi National Rural Employment Guarantee Act (MGNREGA) was another milestone, reflecting a blend of economic and social policy to uplift marginalized sections.
2. Narendra Modi Era (Post-2014):
Background:
With a reputation as a reformist, Narendra Modi embarked on his tenure with immense expectations of economic rejuvenation.
Economic Performance:
- Moderate Start (2014-2016): While the GDP figures in the initial years were decent, they weren’t drastically different from the earlier era. The peak came in 2016 with an 8.26% growth.
- Structural Shocks (2016-2018): With bold steps like demonetization and the implementation of GST, the economy experienced short-term disruptions. The growth rate, especially post-demonetization, indicated the immediate impact of such a radical measure.
- Volatile Recovery (2019-2022): The pre-COVID slowdown followed by the pandemic-induced contraction and subsequent recovery showcased a volatile phase for the Indian economy.
Key Policies:
Modi’s tenure saw a push for ‘Make in India’ to promote manufacturing and the ‘Digital India’ initiative to boost digital infrastructure. The Insolvency and Bankruptcy Code was another key reform aimed at resolving the chronic NPA issue.
Noteworthy Observations:
- Global Events: Both tenures were significantly influenced by global events. The 2008 financial crisis during Singh’s term and the COVID-19 pandemic during Modi’s term are evident in the sharp fluctuations in growth rates.
- Policy Interventions: Both prime ministers implemented key policy decisions that had short-term and long-term implications for the economy. Singh’s tenure was influenced by the opening up of the retail sector to FDI and other liberalization measures. Modi’s era was marked by demonetization, GST, and reforms aimed at formalizing the economy.
- Average Growth Rates: Calculating the average growth rates for both tenures gives a summarized view. For Singh’s tenure (2004-2014), the average annual GDP growth rate is approximately 6.91%. For Modi’s tenure, from 2014 to 2022, the average stands at 6.51%.
Conclusion:
Dr. Manmohan Singh’s tenure stands out for its consistent growth trajectory, resilience during global crises, and astute economic vision. His era epitomizes a balance between robust growth and socio-economic measures. On the other hand, Narendra Modi’s period is characterized by bold, disruptive reforms with mixed immediate outcomes but potential long-term structural benefits.
In examining both tenures, it’s essential to understand that economies don’t operate in silos. While Dr. Singh’s era displays a commendable combination of steady growth and stability, Modi’s time reflects a daring approach to reforms. Both periods offer lessons in the complexities of leading a diverse nation like India through dynamic economic scenarios.
Data Sources:
For India’s GDP data, the following are authoritative sources:
- Reserve Bank of India (RBI): The RBI’s database on the Indian economy offers a plethora of economic indicators, including GDP growth rates.
- Ministry of Statistics and Programme Implementation (MOSPI): This is the Indian government’s official statistics wing. Data released by MOSPI is considered the standard reference for economic indicators in India.
- World Bank & International Monetary Fund (IMF): Both these international organizations provide comprehensive economic data for all member countries, including India. Their databases can be used to cross-reference and validate domestic sources.
- Economic Survey of India: This is an annual document of the Ministry of Finance, Government of India, that reviews the developments in the Indian economy over the previous 12 months.

